

Shift left, ship everywhere
Alright, already, we'll all float on, anyway
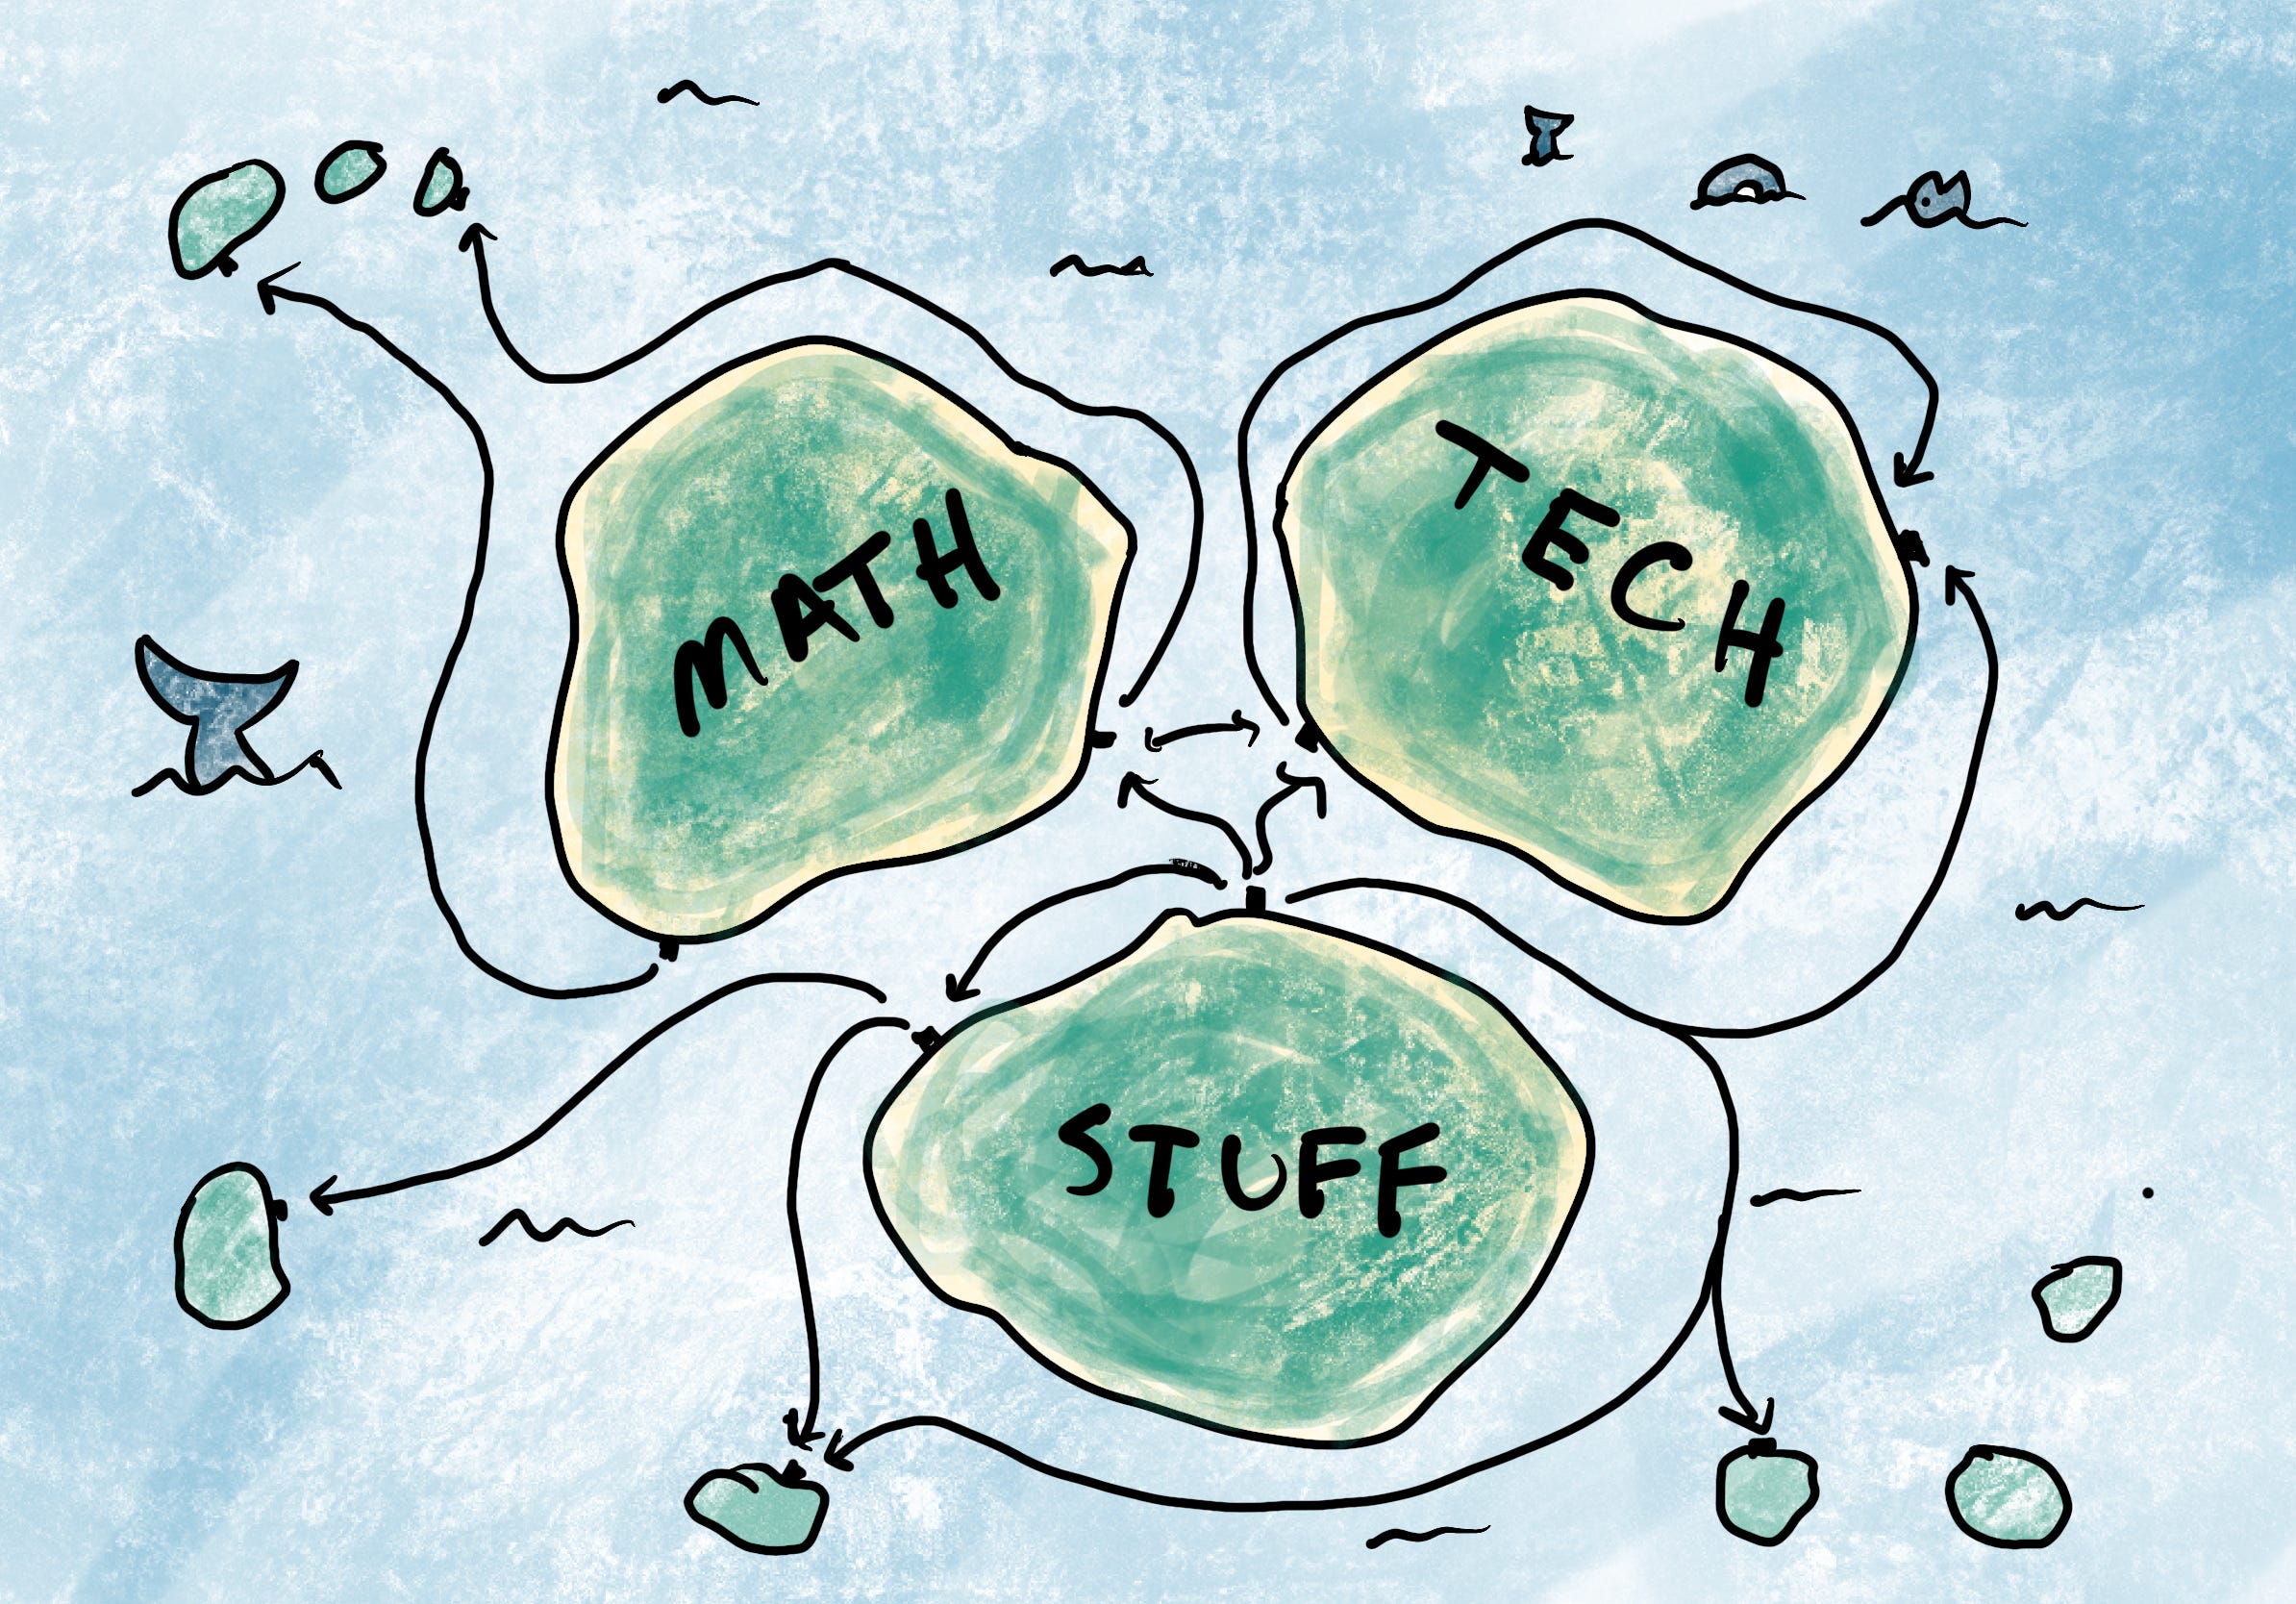
A decade ago, the Venn diagram was the most important tool in the data stack. Since “data science” had no stable meaning but was also the sexiest job of the 20th century, aspirants kept a crumpled-up printout handy to show that they weren’t mastering one skill but three! Or four! Or five!
Data science was the intersection of all these skills—an overlap that conveniently fit into an IPython notebook rather than a curriculum.
I always imagined these circles as tectonic plates violently crashing into each other. The intersections were mountain ranges bursting into the sky. It was a feat to climb this mountain and look down across the valleys of math, technology, and “subject matter.” The data person could feel superior to it all.

He was surprised, then, when he got a job and found himself, his dashboards, notebooks, and predictions fighting for attention and resources. Instead of being at the center of things, he was on the edges.
That’s because the intersection-as-peak model is wrong. The circles are the mountains, the intersections ravines. More than the academic content, the groups are distinguished by shared loves, language, logic, laws, and history. The islands foster cultures that crack different shells and have specialized beaks.
Interdisciplinary work, then, is water work. Its practitioners are more sailors than shepherds, more pirates than prelates. The data scientist’s need to reference a map to answer the “Where are you from?” question was not a temporary, historical fluke but an essential characteristic of their maritime profession.
Shifting analogies—
I enjoyed Chad Sanderson‘s Shift Left data manifesto, published recently. Though it failed to introduce even one polarizing piece of jargon, it summarizes many of the challenges I’ve seen in scaling out data ownership.
Statements like these I fundamentally agree with:
The future of data engineering is not about building bigger, more sophisticated reactive teams—it is about pushing responsibility upstream and empowering the producer teams to own quality at the moment of creation.
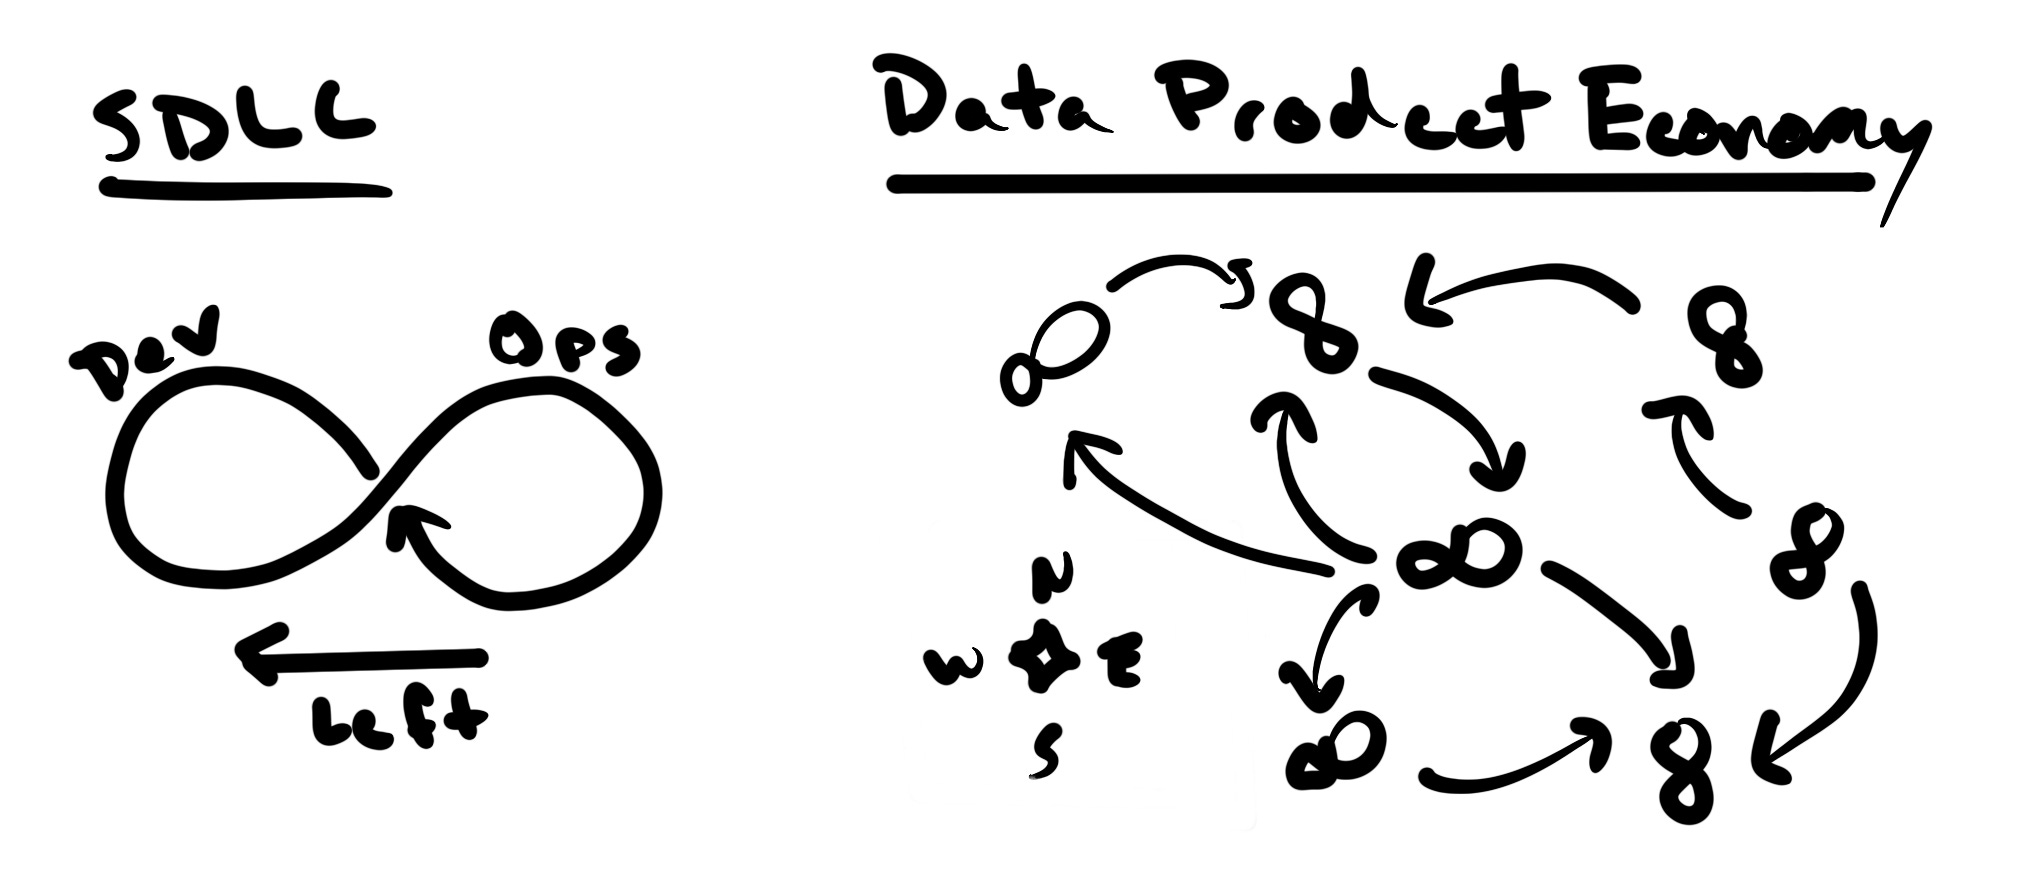
“Shift left” invokes this lovely figure-eight model displaying a continuous loop connecting software development and operational deployment. Its focus is on a coherent piece of software—a convenient example is the two-pizza team.
This can work locally for data products, too. (If we assume data products exist.) But unlike most software products, which have a high degree of logical isolation, data products are heterogeneous, co-dependent, and extremely sensitive to external factors—both upstream supply changes and downstream demand changes can radically alter a data product's utility.
So, like the three-circle Venn diagram, while the “shift left” analogy works at the surface level (i.e., the software team level), it misleads at the economic level. What’s changed for data teams is access to competition—global trade via the seas of the Internet.
To ignore the marketplace context of the “data product” lifecycle is to act like success on the Internet is only the product itself. But when products are indistinguishable to the consumer, and distribution is easy, the key metric is engagement. Mastering the art of influencing discourse is not just the path to virality and success but also to authority.
Engineering and business teams that fail to position themselves as the authoritative source of data will not just have a bad time. They’ll be disrupted as consumers find an alternative source to get answers to their questions, fuel their decision-making, and automate their processes.
The reality I see coming in 2025: They are coming for your data. By they, I mean everyone. The business. The hackers. The customers. And their GPTs.
For software engineers, the shift is not simply in terms of evolving business requirements but in adding a new dimension to how they think about building systems. REST APIs alone won’t cut it. Internal data models aren’t enough. Everyone wants these facts, and they want them in bulk. If they aren’t available on the market today, they’ll be found in the Pirate Bay tomorrow.
Warehouse-native enterprise products, “open tables,” and data apps are already starting to get normalized. One dataset, multiple writers, and dozens of readers. Universal search with LLMs isn’t going to worry about traditional interfaces.
For engineers to feel in control in this world, then yes, there’s a “shift left” in the supply chain and the reduction of middleware. More than this, though, it involves designing products meant to be public and legible by default.
Consumers on the right hand of the supply chain will become more efficient and aggressive in hijacking, vacuuming, contributing, poisoning, refining, and otherwise exploiting this data.
It’s a maritime economy. In the early 2000s, data exchange that used to happen via Silk Road overland routes and routes shifted to Mediterranean trade controlled by Venice and Genoa, a small set of specialized states conveniently located. But with AI and the data hyperscalers, the Dutch have rounded Cape Horn and found a new route to Asia, to global trade routes and new empires.
All of which, frankly, is good news for sailors. It’s a great time to know how to trim the sails, tack and jibe, bail water. For data folks, there’s nowhere to shift; they’ve been adrift for years. It’s sort of, like, their whole thing.
“Data engineers” didn’t exist 15 years ago; “data science” never did exist. We’ll forget we ever used the word “data products” in the same way “netsites” faded into the ether. It’s all part of the great ocean of the Internet, and “data” is just the word for what lies beyond the sight of the comfortable shores, where landlocked islanders gaze out into the foggy horizons.
Love the SDLC vs. Data Products image. Will definitely borrow that, and it’s a key mental model to explain why DataOps is so different from SDLC/DevOps. There is definitely a bunch that can be borrowed, but it’s a whole different ecosystem we’re managing